
Technical analysis is a preliminary step for Forex trading. When you trade Forex currency pairs, you often realise that the combined interest rate on currency pairs change frequently. This change takes place due to the intense volatility of the market. More than $6 trillion are traded in the Forex market, making it the most extensive online trading market. To profit in such a market and manage your risks properly, you must conduct a technical analysis.
Technical analysis can be performed by various technical and analytical tools such as Fibonacci retracements, candlestick charts, moving averages, several oscillators and more. However, out of multiple indicators, there is a crucial indicator known as the Ichimoku cloud indicator. In this article, we will have a detailed discussion on the Ichimoku clouds. Read a detailed forex trading guide.
What are Ichimoku clouds?
The Ichimoku cloud is the technical analysis and charting method discovered by Goichi Hosoda in 1969 in Japan. The Ichimoku clouds were easy to read for those who already had the idea about reading charts. The Ichimoku cloud is not a standalone indicator. Instead, it is the combination of several indicators. It has the ability to predict the support and resistance levels, trend directions and other market conditions to identify entry or exit positions.
The Ichimoku clouds work based on five formulas. These formulas give you an equilibrium chart by combining with each other. In addition, Ichimoku clouds provide you with specific results by plotting multiple averages on the chart. This is essential to understand that this can provide valuable insights to trade a currency pair at a particular time.
The Ichimoku strategy offers different quality trading signals to access the markets. Charting other averages on the same chart will let you know the momentum of a particular trend and its direction. The Ichimoku clouds can provide you with more data points than the usual candlestick chart.
Traders can find the most suitable time to open or close their positions with the necessary trend direction. Ichimoku charts appear to be very confusing and complicated at first glance, but they are not once you get the idea about various things to come into play.
Well-defined training signals will let you know a range of entry and exit levels, and based on these, and you can buy or sell the asset within a fixed time period.
How to use Ichimoku cloud indicator in Forex trading?
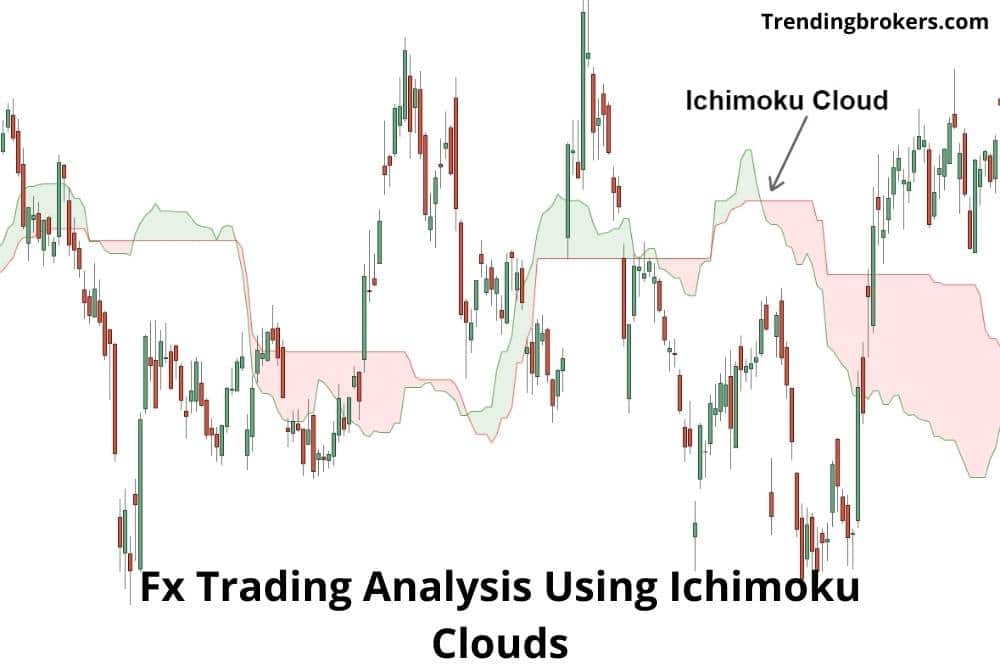
The Ichimoku cloud indicator consists of five different lines that will help you determine the difference between leading span A and leading span B displayed on the chart. After the determination of these two leading spans, the space between these lines will be shaded.
When the leading span A is above the leading span B, the space will be shaded by green, indicating the uptrend. On the other hand, when the leading span A is below the leading span B, the space will be shaded by red, indicating the downtrend. Thus, when there is an uptrend, the price momentum will increase. Otherwise, the price momentum will decrease.
So in case if you are not able to read the chart correctly, only the colour will show you the market directions. However, it will help you identify essential trading parameters, including the major trends and support lines.
Traders use the Ichimoku cloud to determine the location of the price to identify the area of support and resistance levels. Other technical tools only provide the support and resistance levels for the current time. Still, Ichimoku can also give you the support and resistance zones for the future, making it a more efficient technical indicator than others.
Traders use the cloud with other indicators like the Relative Strength Index (RSI) to ensure a particular momentum direction. In addition, traders use the combinations of the Ichimoku indicator with other indicators to manage the risks well and maximise the returns.
How can one interpret the suitable trend from Ichimoku charts?
If the price is above the Ichimoku cloud, there is a bullish trend, and the condition is suitable enough to buy the currency. And if the price is below the Ichimoku cloud, there is a bearish trend, and the situation is suitable enough to sell the currency. And finally, when the price is in the middle of the cloud, then you can witness the consolidated trends or ranging trends.
Calculation of Ichimoku clouds
In calculating the Ichimoku clouds, traders consider the highest and lowest prices during a certain period. Therefore, you need to simply put the Ichimoku cloud indicator on the chart simply, and it will automatically start the calculation and give the required value.
We are discussing the five essential formulas for the lines involved in the Ichimoku cloud indicator.
Conversion Line (tenkan sen) = 9-(PH+PL)/2
Base Line (kijun sen) = 26-(PH+PL)/2
Leading Span A (senkou A) = (CL + Base Line)/2
Leading Span B (senkou B) = 52-(PH+PL)/2
Lagging Span (chikou span) = Closing price at the previously plotted 26 periods
where:
PH = Period high
PL = Period low
CL = Conversion line
The Ichimoku cloud can also be calculated manually. The method of calculation is as follows:
First, you need to calculate the tenkan sen (conversion) and the kijun sen (base) with the formula given above using the ‘period high’ and ‘period low’. Then, derive the leading span A using the values that come from previous calculations. After you get the value of conversion line, baseline and leading span A, plot this data 26 periods into the future. Then similarly, calculate the leading span B and again plot the data for the same periods.
If you want to calculate the lagging span, plot the closing price down the timeline of 26 periods. You can shade the part with the appropriate colour according to the differences mentioned above and create the cloud. Finally, join all the data points to make a line and create the cloud.
So above is the process for the pen and paper calculation of the Ichimoku clouds. Although the method is quite simple and easy to understand, each level of trader can reduce the risk and maximise the potential returns by applying this simple method.
Advantages and disadvantages of the Ichimoku clouds indicator
The Ichimoku clouds come with several benefits and limitations like any indicator. There are various strengths in the behaviour of the Ichimoku Cloud. So many things depend on the trader’s usability and favourable conditions they get from the Ichimoku indicator.
You can easily find the various solutions from your trading journey to make compelling decisions related to forex trading using the Ichimoku charts. However, to make an informed trading decision, you must know the advantages and disadvantages of this indicator.
Advantages
- All the Ichimoku lines and data can be displayed on the chart in correlation with each other. This makes the tool well efficient and convenient for traders.
- Trading with the Ichimoku Kinko Hyo indicator is a great approach to learn how to trade in the direction of the dominating trend and how to keep your positions open as long as possible. It’s a price movement predictor that uses a leading indicator.
- You can easily determine trends. The trend direction is sideways when the price is inside the cloud, and the trend is strong enough when the price is above or below the Cloud. Most other indicators will give you one indication of a trend or signal, and then you will utilise another indicator to determine if that study confirms the previous signal.
- Ichimoku Kinko Hyo can generate signals in the direction of the current trend on its own. Excellent at providing varying amounts of support and resistance. Moving averages can accurately define the trend, but they rarely provide further signs in the trend’s direction. As a result, another oscillator is frequently employed to check the signals. In this situation, Ichimoku alone will suffice for trading in the direction of the trend and receiving other signals.
- While the Ichimoku Cloud can appear cluttered on the screen, platforms like MetaTrader 4 allow you to simply delete lines that you aren’t utilising at the time, giving you a clearer view of the data and lines that are essential. For example, when the price rises above the cloud, the support line is readily visible. When the price is below it, the Cloud’s borders represent resistance lines.
- This saves traders from having to seek vital information on the chart. There is nothing to do but observe the market, wait patiently for a signal to sell or purchase, and then hunt for an exit after the transaction.
- Another feature of this technical analysis tool is that it provides the trader with strict entry and exit rules. Capable of determining the direction and severity of the present market trend. This essentially eliminates the emergence of spontaneously opened positions, which typically have little prospects and result in losses.
Disadvantages
- When used during periods of low volatility, when the trend has not yet been established and the price trades in a limited range, Ichimoku has limits. During non-trending markets, Ichimoku will generate a large number of false signals. The price would continue to break through the Cloud upward and downward, exhibiting no consistent trend, and the signal lines would alternately provide buy and sell signals.
- While having a lot of information on a single chart is great, having a busy chart might interfere with your ability to assess transactions. Positions with close Stops will close disproportionately frequently in such conditions.
- Traders looking for a more predictive method may be disappointed by the Ichimoku Cloud’s trading signals. However, such situations are infrequent, what is crucial here is to avoid overestimating the lot. Therefore, it is advisable to wait until solid signals return. This can be fixed by customising the indication and deleting unwanted lines, but it adds more steps to your analysis, slowing it down.
- Orders for taking profit can be placed at any point outside of the cloud. Stop-loss orders should be put in or near the cloud’s edge, and money management strategies should always account for the risk of maximum losses if cloud support fails. It is one of the most unique and robust indicators utilised by traders all around the world. To understand how the indicator works, keep in mind that Ichimoku is more of a strategy than a technical indicator.
Bottom Line
There are various technical indicators out there that you can use while performing technical analysis. But the Ichimoku indicator stands out as it can show you the future support and resistance levels also. Plus, it can give various beneficial insights that other indicators may not be able to provide you with. But please be aware of the multiple limitations also while using this indicator. The Ichimoku indicator is widely used by traders worldwide. Many traders have appreciated the indicator, and it keeps gaining popularity among novices also.
If you want to make this tool a part of your technical and fundamental analysis for forex trading, the tool is available on a world-class trading platform offered by the reputed forex brokerage firm ETFinance.