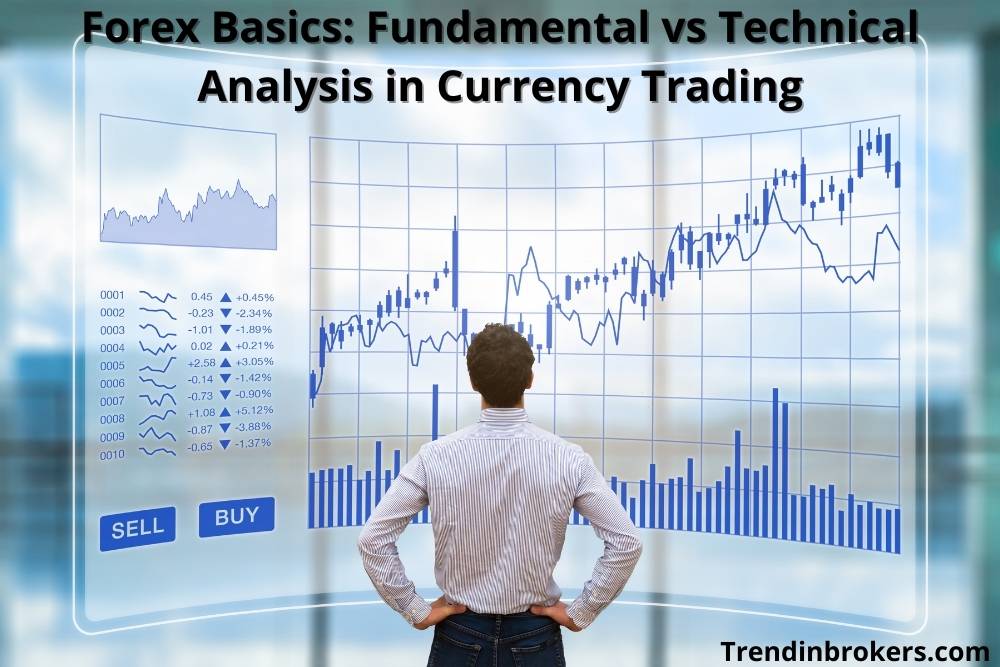

Introduction
Forex market trades in international markets with various currency pairs and, therefore, requires an in-depth analysis of the forex market. The analysis with the use of various trading platforms and tools guides traders or investors; they are able to make the right decisions for earning profits and maximising the returns. Fundamental vs Technical analysis of Forex includes examining the currency fluctuations and the factors affecting the same.
Traders invest by buying and selling the currency pairs to earn from the difference, i.e. the gap between base and quote price of the currency. For analysing the gap and factors influencing the change of prices, fundamental and technical analyses are used.
The fundamental analysis relates to the impact of political, economic and social components of the forex market. The value of a currency is affected by a country’s global situation, including all the aspects of the government, economy etc. Thus, traders need to be updated and well informed about the factors. Moreover, by analysing them, the decisions of the trader are more accurate and polished.
Technical analysis, on the other hand, relates to the price changes in the future. With technical tools, traders can examine the previous trades, price changes taking along present changes. The patterns are studied of the price movements, and based on that trader predicts the future changes.
How does Forex Analysis work?
The foreign exchange market being a significant part of the trading world, the market on a daily basis trades in millions of dollars. To buy and sell currencies in such a market requires a lot of effort with good analysis. In addition, retailers and financial institutions invest in the market for opportunities and potential growth. That makes the market available for traders 24 hours a day on global exchanges.
The forex market works in currency pairs and, therefore, is different from other markets. Here, if one currency pair is purchased, then another currency pair is sold. Some of the major currency pairs are EUR/USD, EUR/JPY etc.
With several currency pairs, it becomes pretty tricky for traders to decide on investment. For this purpose, traders use analysis tools for examining the forex market. The technical vs fundamental analysis aid traders with an insight into the forex world. Traders can determine the price changes and factors that lead to the change. The tools are essential for trading in the market with an understanding of the trade.
What is fundamental analysis?
Fundamental analysis looks into the intrinsic value of the trade, factors affecting them, economic conditions affecting the value of the currency. A trader has to check on the economic conditions of the underlying currency of the country. It incorporates several factors such as politics, economy, social changes and many more.
Traders who want to have a better fundamental analysis need to be updated with news, economies and such components of the forex trade. For a better understanding of fundamental analysis, the below-mentioned factors need to be studied
Economic Indicators
The economic health of a country is important for any trade, with so many factors impacting the nation’s economy. Therefore, traders have to keep an eye on the economy to manage their forex trade. Economic indicators of the economy are the reports that suggest a nation’s economic health. The reports are published by government and private institutions.
Economic indicators are released at a particular time to update traders on the nation’s progress. If the nation’s economy is declining, traders should sell the currency pair to secure themselves from unnecessary loss. Whereas, if the economy increases, then traders can buy more currency pairs to have high profits.
In forex markets, the deviation from the norm can cause a significant change in trade volume. So, economic indicators are essential for fundamental analysis; some examples of economic indicators are unemployment reports, policies change etc.
Gross Domestic Product (GDP)
The most widely used fundamental analysis indicator is the gross domestic product. GDP is calculated by every sector of the economy and has a massive impact on the economy. It is the measurement of value that is created via the production of goods and services. Hence, representing the total market value of the goods and services produced in a year. A country’s GDP is considered a lagging indicator, and therefore, traders prefer to use advance reports and preliminary reports. The study of these reports causes volatility and the GDP being the total production help traders in analysing the internal growth of the economy.
Retail Sales
As the name says, it relates to the measurement of total receipts of a store or a company. It takes diverse samples of retail stores of a nation; it gives traders an idea of consumer spending. Thus, traders can predict the forthcoming changes in the market and economic direction.
Industrial Production
Industries are a core part of an economy for a nation. The industrial production report is the reference to the change in the production of factories, mines and companies etc., in a country. With each factory’s production capacity, traders can also analyse the production of goods and services. An indicator of utility production, industrial production can be volatile.
Consumer Price Index
The consumer price index measures the change in price and production of a good in a nation. It is analysed with over 200 plus different categories and helps traders see if the nation is increasing or decreasing the profit on production. However, it is quite difficult due to the uncertainties of the trade and economic changes globally.
What is technical analysis?
Fundamental vs technical analysis is significant for traders to understand but before comparing, what each term stands for is also important. So, to better understand the terms and their use for trade, we have individually focused on each term.
Technical analysis is used in every sector of trade, as it analyses the primary reason for the whole trade. Price is necessary for profits, investments and trade; without it, we won’t be able to trade or invest. The technical analysis goes into the depth of price changes in the present, past and then predicts the future changes. Thus, becoming a vital factor of the forex trade.
There is a range of techniques that are used for technical analysis. For a good understanding of the forex trade analysis, we have to know the uses of the techniques and how traders should use them.
Forex Chart Patterns
Technical analysis could be studied using the facility of charts and patterns. Numerous patterns are available through the brokers for trading. The trading platforms that brokers provide help traders with access to charts and patterns. It includes wedges, channels, triangles, bottoms and many more. In addition, quantitative techniques such as moving average, Bollinger Bands, oscillators etc. that aid traders in analysing the price fluctuations.
Wedge Patterns
Wedge patterns generally indicate the reversal of the price in the market. If the wedge patterns show a downward trend, traders expect a reversal and the trend may change to an upward trend. The reversal takes place after the breaking point through the top of the pattern. The wedge patterns are bullish or bearish depending on the market and the ongoing trend of the wedge. However, wedge patterns are best for long term trade.
Bollinger Bands
Bollinger Bands are represented on charts through the lines, one being the standard deviations above a simple moving average and the other being two-line standard deviations below the simple moving average. Considered an excellent measure for the uncertainty of the forex market, Bollinger Bands are best to analyse the price movements.
If the price chart shows an upper band if closer to price, then there is an overbought situation, and if the price gets closer to the lower band, there is the condition of oversold. Depending on this, traders can manage their market positions and forex trade.
Candlestick Patterns
Candlestick patterns are essential for short term price movements. These study the market price changes and represent them through charts and patterns. The various types of candlestick patterns help traders analyse the forex market fluctuations. Moreover, they help identify the critical turning points in trade through patterns like hanging man, hammer, evening starts etc.
However, traders should use more than one technique of chart and patterns for better decisions and confidence in the trade.
Reverse Charting
Charting is the best technique for analysing the market change that is not available for other markets. The reverse charting technique is the oldest and has vanished due to computerisation. However, it was used when traders were not able to understand the change. To analyse such situations, traders used to reverse the chart, that is, to turn it upside down.
During the paper trading techniques, investors reversed the chart and then tried to study the price changes. It was a good technique and also a helpful one. The currency pairs were studied, and base and quote currencies were analysed.
Fundamental vs Technical Analysis
Fundamental vs technical analysis in currency trading have different uses and studies. Until now, we have studied how the two have different functions to execute in the forex trade and what all tools they use for analysing currency trading.
To understand it from a different perspective, we have compared the two. This would help traders know what function they perform to analyse the forex market.
Fundamental vs Technical analysis in currency trading
The base of change in the two is their areas of analysing the market. In currency trading, both have different executions for their tools. Fundamental analysis is for updating the trader with the economic changes of the nation or country. In contrast, technical analysis is for the study of price movements. It analyses the past prices and present prices through various indicators so that traders can forecast the change.
Definition
The terminologies are different, and so is their definition. However, fundamental analysis is the study of the forex market through indicators such as economy, politics, social changes, consumer price index, etc.
Whereas technical analysis is defined as the technique that uses various tools to study the price change of the forex market. It guides traders to make decisions on investment but also aids to enter and exit markets.
Source of Data
Fundamental vs technical analysis in currency trading has one more aspect of difference, that is the source. Both have sources based on which the data are analysed. Fundamental analysis uses the sources of news, economy, gross domestic product, consumer price index etc.
On the other hand, technical analysis uses sources of price charts only to analyse the forex market. It studies in detail the price movements and then makes traders aware of that shift of price.
Entry-Signals
Fundamental vs technical analysis in currency trading has one more point that varies them: the entry signals. Both have different entry signals that indicate the entry and exit of the forex market. In technical analysis, price formations on charts and technical indicators signal traders of the price change. While in fundamental analysis, traders buy when the currency pair is undervalued and sell during overvalued conditions.
Traders
Traders of currency trading have different approaches towards the market. In technical analysis, traders go for short term trades, whereas fundamental analysis traders go for mostly long term trades.
Similarities of Fundamental vs Technical Analysis
Although the two analysis techniques have different tools and analysis patterns, they still have a similarity. Fundamental vs technical analysis in currency trading has the likeness of helping traders to meet up their market goals. By analysing economic aspects and price, traders can quickly know when and where to invest to earn profits. Thus, the analysis aids in making a profit and maximises the potential of growth of the traders.
Traders use both the analysis together to have an overall picture of the forex market. Currency trading is not easy, but the fundamental and technical analysis makes it straightforward for traders.
Conclusion
Fundamental vs technical analysis in currency trading is a valuable tool for studying the market dynamics. A trader won’t be able to succeed in forex trade without the two. The article discusses all aspects of currency trading that must be known and understood by investors in detail. Traders can use the two together for better results and confident trade.
However, the analysis tools are accessible through online brokers. The brokers such as TradeATF furnish their clients with trading platforms. The trading platforms incorporate many indicators, techniques and analysis patterns and charts for making it easy for traders to invest in currency trading.